Using the ABI 7500 in RT-PCR, one can assess changes in gene expression by comparing the threshold cycle (Ct) of PCR product detection. How many cycles (X-axis) are required to reach a given level of fluorescence (Y-axis) within the log-linear range of amplification? More abundant mRNAs require fewer cycles of PCR amplification to generate the same amount of product, and therefore, fluorescence. Since each cycle represents a doubling of the PCR product, a one cycle difference in Ct represents a two-fold change in expression.
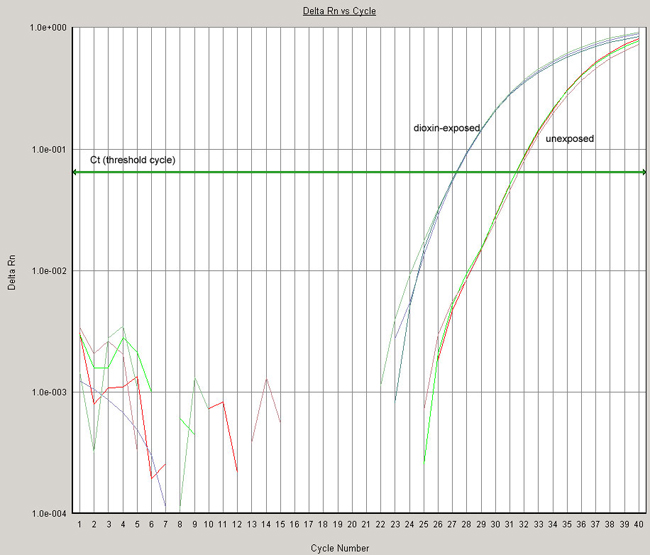
Fig. 1. Cytochrome P4501A6 mRNA is induced by dioxin. Total RNA from was isolated from control and dioxin-treated Xenopus laevis tadpoles and reverse transcribed using random hexamer primers. cDNA products from 10 ng of total RNA were used as a template in real-time PCR with SYBR Green DNA detection dye. Each PCR reaction was performed in triplicate.
Note the leftward shift in the CYP1A6 amplification curve in the dioxin-treated samples.
Average Ct values for CYP1A6:
- Unexposed samples: 31.420
- Dioxin-exposed samples: 27.240
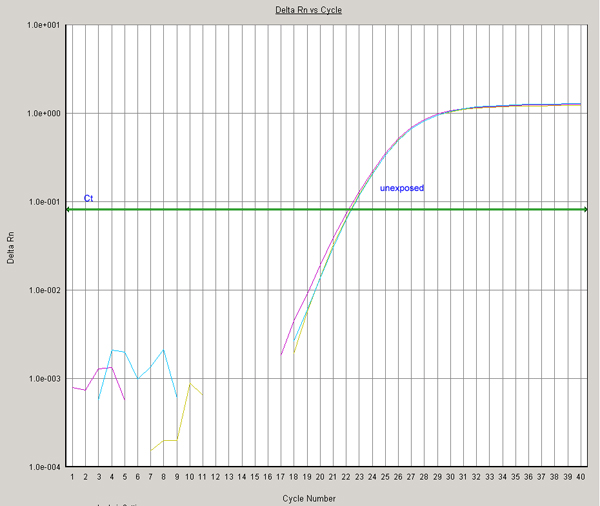
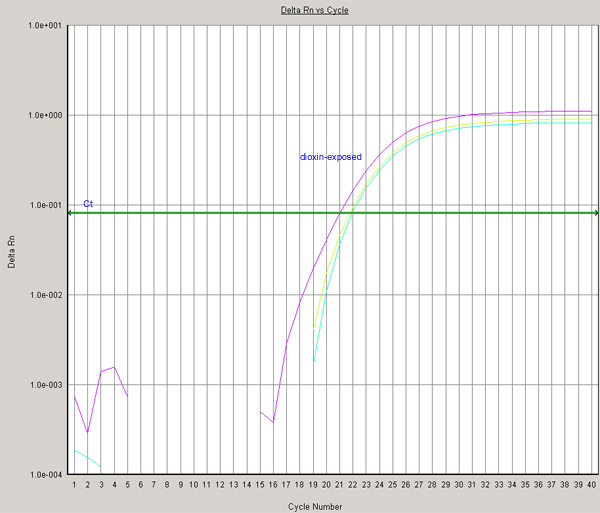
Fig. 2. Ct values for CYP1A6 are normalized to beta-actin by subtracting the average Ct value for each treatment. Expression of this housekeeping gene should not change in response to dioxin exposure. Small variations in the amplification curves and Ct values (compare panels A and B) are used in normalizing the Ct values for CYP1A6 (derived in Fig. 1).
Average Ct values for beta-actin:
- Unexposed samples: 22.268
- Dioxin-exposed samples: 21.565
This is accomplished by subtracting the mean Ct for beta-actin from the mean Ct for CYP1A6. Resulting values for each treatment group are called the delta Ct values.
delta Ct values:
- Unexposed samples: 31.420 - 22.268 = 9.152 +/- 0.208 (SE)
- Dioxin-exposed samples: 27.240 - 21.565 = 5.675 +/- 0.211 (SE)
(Panel A)
(Panel B)
Next, the relative CYP1A6 expression in control and dioxin-treated tadpoles is quantified using the delta-delta Ct method.
First, the delta Ct value for each treatment group is normalized to that of a single group through subtraction. In our experiment, we will normalize CYP1A6 expression to the untreated samples:
delta-delta Ct values:
- Untreated samples: 9.152-9.152 = 0
- Dioxin-treated samples: 5.675 - 9.152 = -3.477
Finally, the relative expression is determined by raising 2 to the power of the negative value of delta-delta Ct for each sample. This value is often termed the RQ value.
RQ values:
- Untreated samples: 20 = 1
- Dioxin-treated samples: 2-(-3.477) = 11.135
In other words, if we define CYP1A6 expression as 1X in untreated animals, this gene is induced 11.1-fold by dioxin-exposure.
Part of the data table in the ABI 7500 software looks like this:

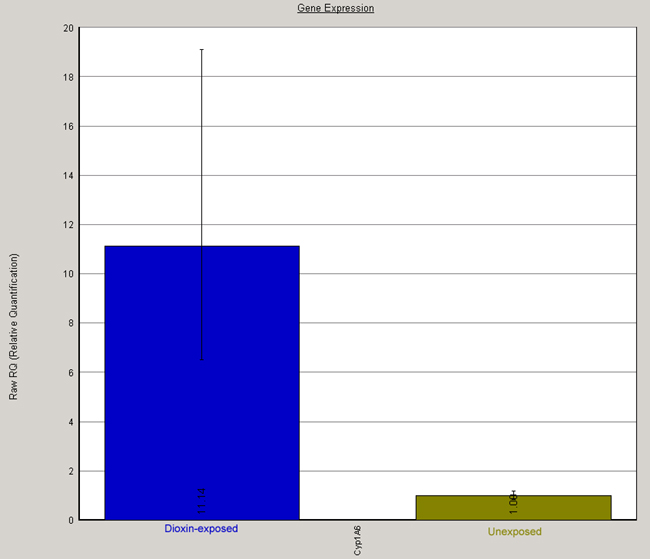
Fig. 3. Relative CYP1A6 expression in control and dioxin-treated tadpoles expressed as RQ values. RQ values for CYP1A6 mRNA under each condition are plotted in a bar graph.
A note about error bars:
In this figure, you see error bars bracketing the RQ values. These bars are not statistical error per se; rather, they represent the range of possible RQ values defined by the standard error of the delta Ct's (In the table above, these values are called "RQ Min" and RQ Max.").
For example, the delta Ct value for dioxin treated animals was 5.675 +/- 0.211 (SE). Thus, within the bounds of defined by the standard error, it could range from 5.464 up to 5.886. By using these minimum and maximum values in in delta-delta Ct and RQ calculations, we can predict minimum and maximum values for RQ. It is important to understand that these error bars don't represent true standard errors of the actual value being graphed. Also, because the variation is in the exponent and not the number itself, error bars above the RQ value extend a greater distance than those below.
Questions for students to ponder:
- Do you believe any of this? How accurate is this assessment of relative CYP1A6 expression?
- Besides reverse-transcribed mRNA, what other sources of CYP1A6 DNA may serve as templates for PCR?
- Why should we care?
- How can we identify and control for PCR products that don't relate to mRNA expression?