Extrapolating from Summer Science Research
Extrapolating from Summer Science Research
Purpose
This study addressed two specific questions: 1) How do natural, restored, and created wetlands differ in terms
of biological diversity and ecosystem characteristics? 2) What do amphibian populations have to tell us about the
health of a wetland? In this study we tested amphibians as ecological indicators of wetland condition, with the
hope that we would be able to distinguish defining characteristics for each the natural, restored, and created
wetlands and determine the environmental factors that need to be improved in order to support the natural wetland
life.
Methods
Six different wetland sites within central Ohio were used in this study. Of these six sites, two were natural,
two were restored, and two were created (table 1). The biological integrity of the three types of wetlands was
found by using amphibian populations as an ecological indicator.
Amphibian populations were sampled at each site between two and five times depending on the drawdown
dates (table 1). In order to sample amphibian populations, a capture-release technique using funnel traps was used.
Ten microsites were marked at the beginning of the study at each of the six wetlands. During each sampling date,
a funnel trap was set at each microsite. Funnel traps were set for no longer than 24 hours. Upon collection of
the funnel traps, the total number of amphibians and the number of each species of amphibian were recorded for
each microsite. Any unidentifiable species were preserved and taken back to the lab as a type specimen.
Environmental variables were also surveyed at each microsite during each sampling date. Environmental variables
surveyed included the percent vegetation (by species), conductivity, water depth, water temperature, and pH. Water
samples were collected at each microsite and analyzed in the lab within 72 hours to find turbidity and phosphorus
content.
Site means were calculated using information collected, including amphibian populations, environmental variables,
and chemistry tests, from each microsite. Multivariate analyses using the statistic program SPSS were completed.
These multivariate tests compared relationships between correlated environmental variables and amphibian populations
at each type of wetland. Out-lying points (due to drawdown when amphibians could not be sampled) were deleted from
the data set.
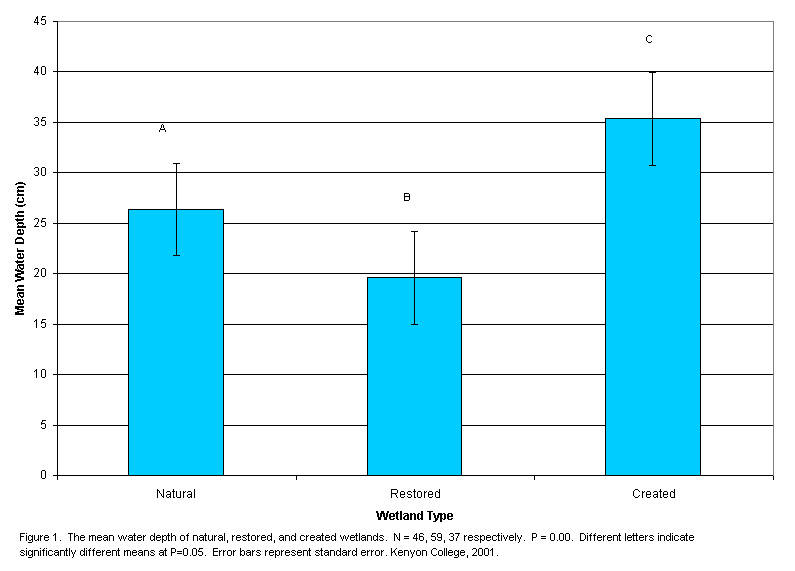
A total of 135 samples were taken from the natural, restored, and created wetlands combined. Means of environmental
variables greatly varied between wetland types. There was a significant difference in the water depth within the
three types of wetlands. The mean water depth in created wetlands was highest, followed by natural and restored
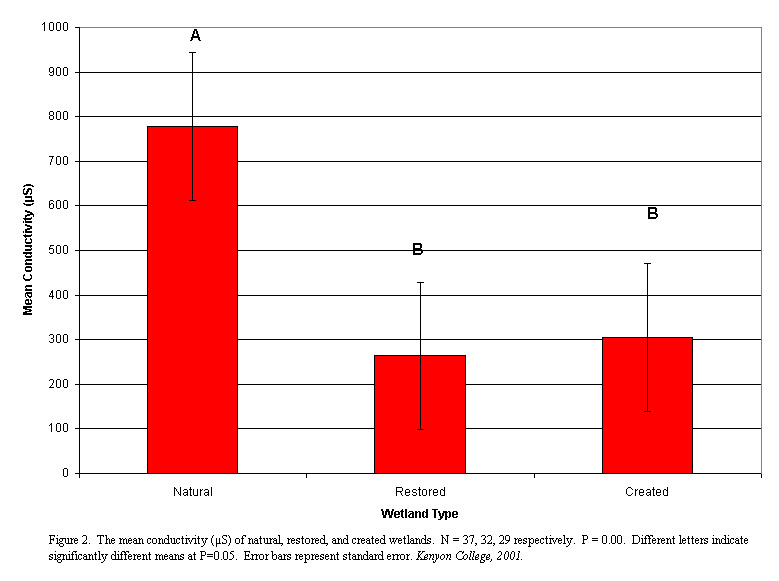
wetlands, respectively (figure 1, p=0.05). There was also a significant difference in conductivity
between the three types of wetlands. Conductivity was more than twice as high in natural wetlands as restored and
created wetlands (figure 2, p=0.00).
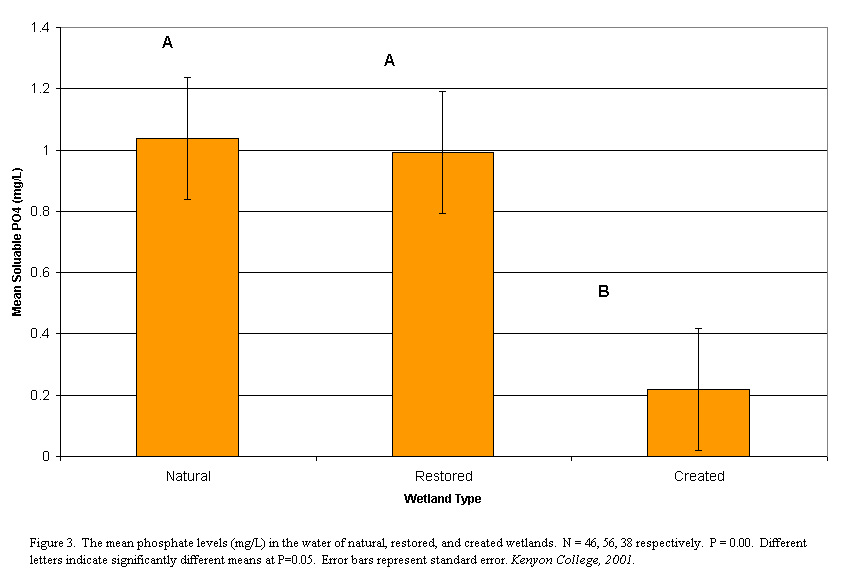
Soluble phosphate concentrations were extremely low in created wetlands; restored wetlands had more than four times
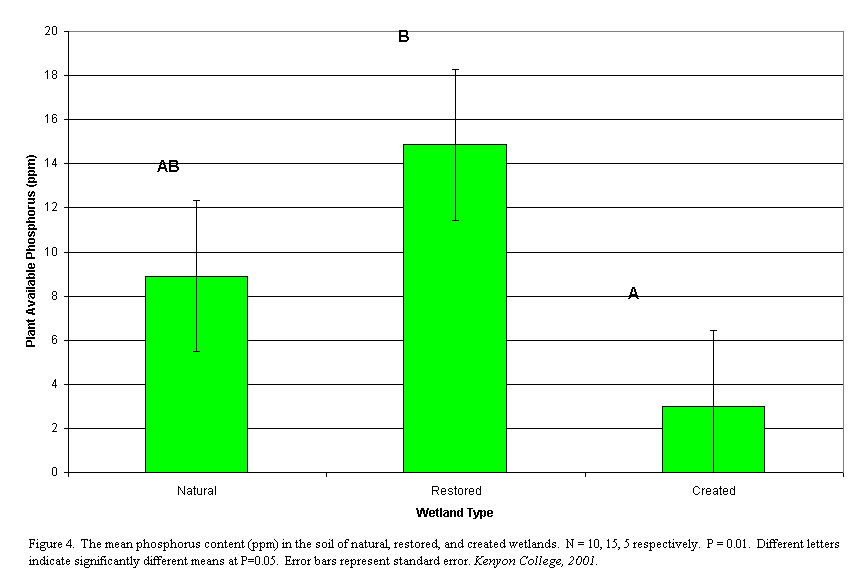
the amount of phosphate in the water than created wetlands (figure 3, p=0.00). Phosphorus
content in the soil was also highest in restored wetlands and lowest in created wetlands. Created wetlands had
only 20% of the levels of phosphorus concentrations as restored wetlands (figure 4, p=0.01).
There were trends in the data for turbidity and pH levels between natural, created, and restored wetlands, although
results were not statistically significant (analysis of variance, p=0.374, data not shown). However, the turbidity
in restored wetlands was almost twice of that in created and natural wetlands. The pH levels in created wetlands
was generally more basic (higher) than those in natural or restored wetlands (table 1). pH ranged from 6.98 at
Rickenbacker, a natural wetland, to 8.51 at New Albany, a created wetland.
Table 1. Environmental variables at wetland each site. Water depth, water temperature, pH, conductivity, PO4, and turbidity are means. Exact dry down dates are not known, but estimated using field observations. Amanda Nahlik, Kenyon College, 2001.
|
Site |
Type |
Year Established |
Water Depth (cm) |
Water Temperature (°C) |
pH |
Conductivity |
PO4 (mg/L) |
Turbidity (FAU) |
Drawdown Date |
|
Ballfield |
Natural |
* |
27 |
28 |
7.34 |
1287 |
0.48 |
50.47 |
* |
|
Rickenbacker |
Natural |
* |
15 |
31 |
6.98 |
202 |
0.51 |
167.13 |
By 7-20-01 |
|
Killbuck |
Restored |
1994 |
25 |
29 |
6.94 |
180 |
1.98 |
37.88 |
By 7-15-01 |
|
Sacks |
Restored |
1998 |
22 |
28 |
9.40 |
272 |
1.23 |
44.47 |
* |
|
New Albany |
Created |
1996 |
35 |
28 |
8.51 |
305 |
0.22 |
33.26 |
By 6-28-01 |
|
Bluebird |
Created |
2000 |
20 |
24 |
8.22 |
557 |
0.74 |
27.92 |
* |
Table 2. Species data at each wetland site. Floristic assessments were conducted by Siobhan Fennessy and Abby Rokosch. Amanda Nahlik, Kenyon College, 2001.
|
Site |
Type |
Amphibian Species Richness |
AQAI |
Number of Amphibians Captured |
Flora Species Richness |
FQAI |
Percent Native Flora Species |
|
Ballfield |
Natural |
5 |
4.71 |
348 |
60 |
29.12 |
86.6 |
|
Rickenbacker |
Natural |
3 |
3.62 |
85 |
29 |
16.5 |
86.2 |
|
Killbuck |
Restored |
2 |
4.93 |
79 |
28 |
14.9 |
89.2 |
|
Sacks |
Restored |
4 |
2.26 |
131 |
13 |
10.1 |
92.3 |
|
New Albany |
Created |
1 |
2.16 |
207 |
24 |
11.2 |
70.8 |
|
Bluebird |
Created |
3 |
2.03 |
92 |
32 |
13.5 |
75.0 |
Amphibian species richness was highest in natural wetlands, with an average species richness of 4. Created wetlands
had the lowest amphibian species richness, with an average species richness of 2 (table 2). As expected, restored
wetlands had an intermediate level of species richness and hosted an average of 3 species (table 2). The Amphibian
Quality Assessment Index (AQAI) values for each wetland support the species richness data (table 2). Mean AQAI
values were 4.17, 3.60, and 2.10 for natural, restored, and created wetlands respectively. The total individual
amphibians captured was higher in natural wetlands than both restored and created wetlands by 233 and 134 individuals
(respectively).
The flora species richness was also highest in the natural wetlands, supported by the calculated Flora Quality
Assessment Index (FQAI) values (table 2). In natural wetlands, the mean flora species richness was almost twice
high as that of restored and created wetlands (table 2). The mean FQAI value for natural wetlands was more than
two-thirds higher than the restored and created wetlands, which had very close FQAI values. The percent native
flora species found at each wetland was surprising: restoration wetlands supported 90.8 percent native species,
whereas natural and created wetlands only supported 86.4 percent and 72.9 percent respectively (table 2).
Using multivariate tests, it was concluded that the components (environmental variables) representing the most
variability within each wetland type were conductivity, turbidity, algae, and lemna (principle component 1, x-axis)
and the number of individual amphibians and pH (principle component 2, y-axis). Using a scatter plot to graph the
scores for each component, I found that natural, restored, and created wetlands are fundamentally different (figure
5). Natural wetlands have a wide range of conductivity, turbidity, algae, and lemna levels, but all of the natural
wetlands host a high number of amphibians and have a low (acidic) pH. Note that all of the natural wetlands fall
above zero, and mostly in the first quadrant, on the component matrix. The created wetlands are found below zero,
mostly in the third quadrant, in the component matrix, signifying that they had low conductivity, algae, and lemna
scores and a high turbidity score. The created wetlands also lacked large numbers of amphibians and had a high
(basic) pH. Restored wetlands fell into the middle of natural and created wetlands. They have wide ranges of conductivity,
turbidity, algae, and lemna as well as number of amphibians and pH. However, most of the restored points lie below
zero on the component matrix.
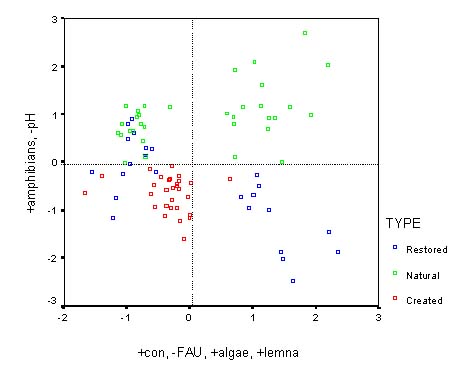
Figure 1. A component matrix scatter plot comparing environmental variables of natural, restored,
and created wetlands. The first principle component (x-axis) is represented by positively correlated conductivity,
algae, lemna, and negatively correlated to turbidity. The second principle component (y-axis) is made up of the
number of amphibians and negatively correlated with pH. The first component represents 24.53 percent of the total
variance, while the second component represents 16.92 percent of the total variance.
It is evident from figure 5 that there is a difference between natural, restored, and created wetlands. This difference can be attributed to the health of the wetland, which includes the environmental variables represented in table 1. Natural wetlands have a higher biological integrity than created wetlands, as indicated by the number of amphibians and supported by the correlation of environmental variables. Restored wetlands are not as healthy as natural wetlands, but not as degraded as created wetlands. This is indicated by the large spread within samples (points) in figure 5.
Conclusions
Natural, restored, and created wetlands have fundamentally different environmental conditions (Figure 5). Land
use history of the area near wetlands may explain some of the differences between natural, created, and restored.
Many of the restored wetlands were converted from agricultural fields or are located near agricultural fields (personal
observation.). The nutrients that leech into soils from farming may explain the drastically high levels of phosphorus
in the water and soil.
The differences in depth between the wetland types may be the result of a lacking water source, such as a natural spring or a high water table. While natural wetlands generally have a source of water throughout much of the year, created wetlands are generally more like ponds - they are filled with water and collect water from rain and runoff making them deeper.
The percent native flora at each type of wetlands was surprising. It was found that restored, natural, and created
wetlands had decreasing numbers of native flora (table 2). A possible explanation for the high percentage of native
species in restored areas is that native species may have been artificially established (i.e. planted) during restoration,
and the few years since restoration has not been enough time for exotics to become established. In addition, it
is important to look at species richness; even though restoration wetlands supported the highest percentage of
native species, the species richness of restored wetlands was the lowest (table 2).
Our data from the amphibian quality assessment index supports the idea that amphibians can be used as ecological
indications for wetland health. Our results were expected - natural wetlands have higher levels of diversity than
do created wetlands, suggesting that natural wetlands also have a higher ecological integrity (table 2, figure
5). Restored wetlands are in the median of natural and created wetlands for both biodiversity and integrity (table
2, figure 5).
This study supports previous studies that indicate that replacement wetlands do not have equivalence of natural
wetlands. The differences in environmental variables, such as water depth, turbidity, and phosphorus content, are
obvious between the three types of wetlands (figures 1-4, table 1). In addition the biodiversity for amphibians
and flora was highest in natural wetlands, followed by restored, and created wetlands respectively (table 2). The
inadequacy of restored and created wetlands to maintain water chemistry, hydrology, and biodiversity levels of
natural wetlands suggests that they lack several pertinent characteristics of wetlands.