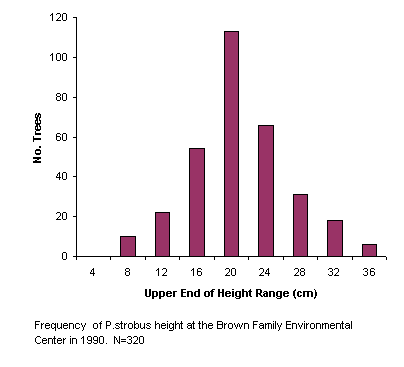

The means for the three samples are shown below. Note that they are all close to the actual population mean of 19.32 cm.
The mean for a sample of 10 trees was 20.76 cm.
The mean for a sample of 20 trees was 21.77 cm.
The mean for a sample of 40 trees was 20.08 cm.
Which is the most accurate representation of the "true" mean of the population?
Examine the effect of sample size on estimating the "true" mean of a population.