Error Bars
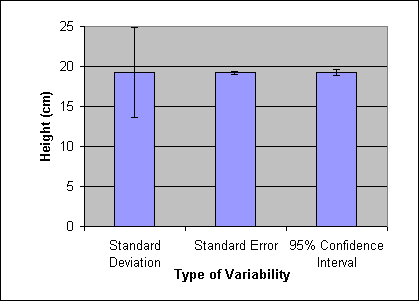
The figure on the left compares three ways of representing variability in a figure using vertical error bars. The data are based on height measurements from 900 one-year old white pine trees. Each error bar is derived from the same data set. Note the differences in the lengths of the error bars. For this reason, it is important that you indicate the type of error bar being used in the caption of the figure.
Because of its ability to predict the range over which the mean would be expected to lie 95% of the time, the 95% confidence interval is often the preferred measure of variability.
Return to the Moodle page to link to quiz questions for this Tutorial.