|
|
|
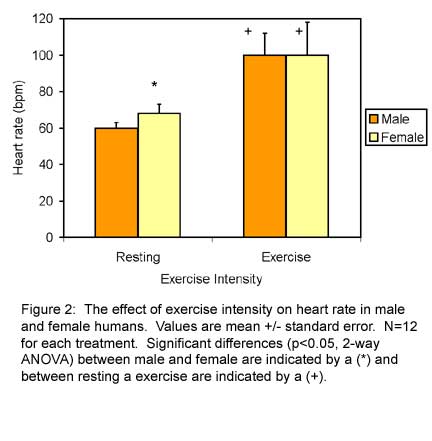
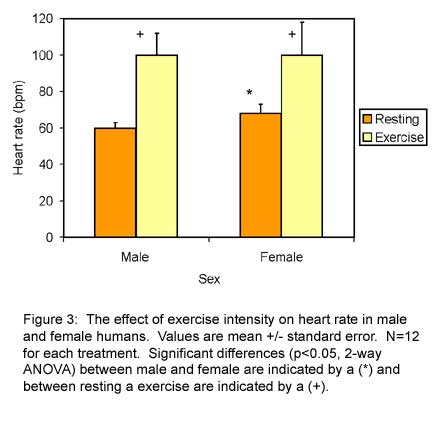
Authors must make certain decisions when constructing a graph to
represent the results of their study. Consider Figures 2 and 3 below.
Both figures use the exact same data set to describe an experiment
with two independent variables: gender and exercise. Notice, however,
that each figure stresses different parts of the experiment.
|
|
(Note: The data for these graphs were created to
illustrate graph-reading strategies. The graphs do not necessarily
demonstrate the actual heart rate responses of men and women.)
|
EXAMPLE 2. Interpreting Figures 2 and 3.
Questions:
- Based on Fig 2 or 3, does exercise affect heart rate?
-
Based on Fig 2 or 3, is there a gender
difference in heart rate?
-
Based on Fig 2 or 3, does exercise influence
the difference in heart rates between males and females?
-
Which figure is more effective at stressing
a difference in heart rate between males and females?
-
Which figure is more effective at establishing
a difference between exercise and resting?
- Yes, heart rate increases after exercise
- Yes, females tend to have higher heart rates at rest than
males.
- Yes. In the resting condition, females have a higher heart
rate than men. However, after exercise, the heart rates of males
and females do not differ.
- Figure 2 shows these differences most clearly because it directly
compares the heart rates of males and females based on exercise
type.
- Because heart rates at rest and heart rates during exercise
vary greatly, both figures effectively establish a difference.
The magnitude of the difference in exercising and resting heart
rates for each gender can be most easily viewed in Figure 3.
Click here to continue.
|
|