How does sample size affect your estimate of the "true" mean of a population?
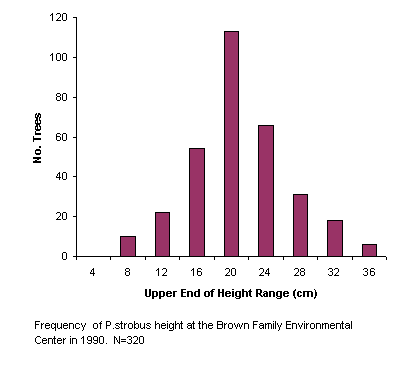
The distribution of tree heights at the time of planting is shown on the left. Examine the figure to the left. The values indicated on the x axis represent the upper end of the range. For example, values from 4.1 - 8.0 are indicated by the bar labeled 8.
Note the range in tree heights is from 4.1 - 36.0 cm.
Between which values does the central tendency lie? Check yourself.
The average height of the 320 trees is 19.32 cm. does it lie in the same range?
You do not have time to measure all the trees. How accurately would smaller sample sizes estimate the "true" mean of this population? Examine the frequency distributions of three different sample sizes.
Are the means of the three samples the same? Click to see how they compare.