Gambier Wastewater SARS-CoV-2 Virus Report
Archive for
2020-2023
Current data reported
here.
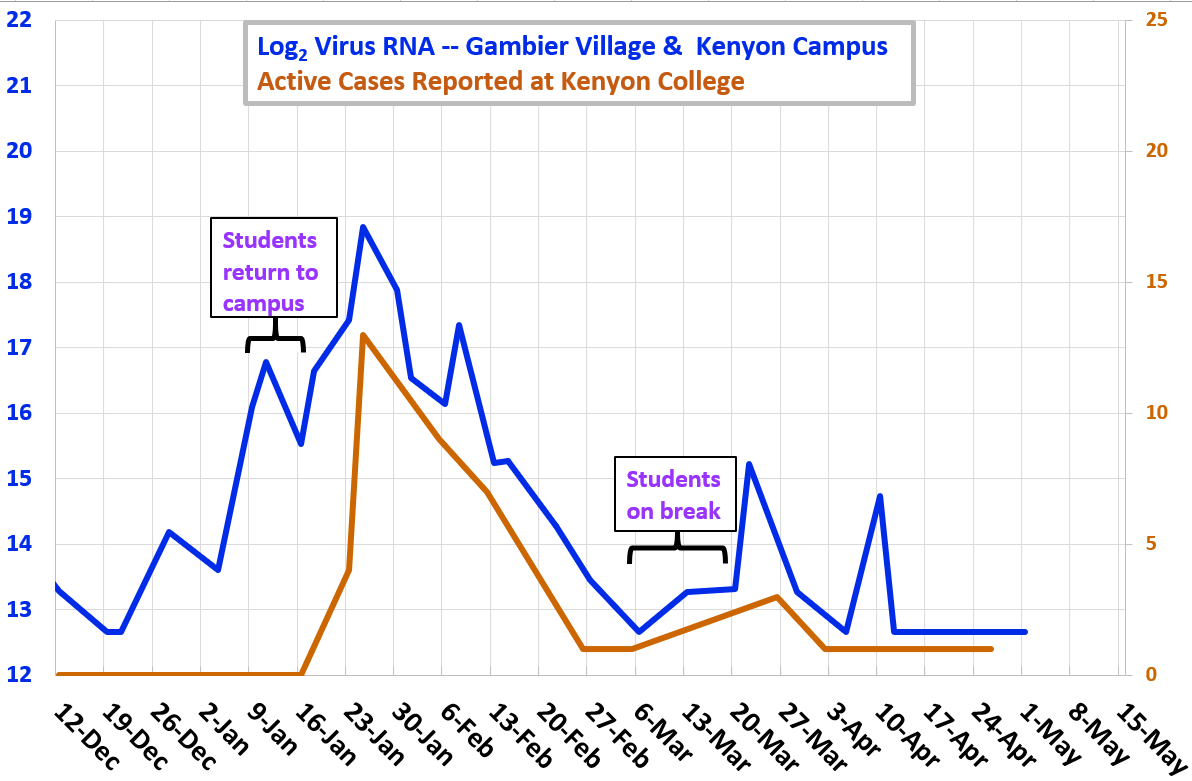
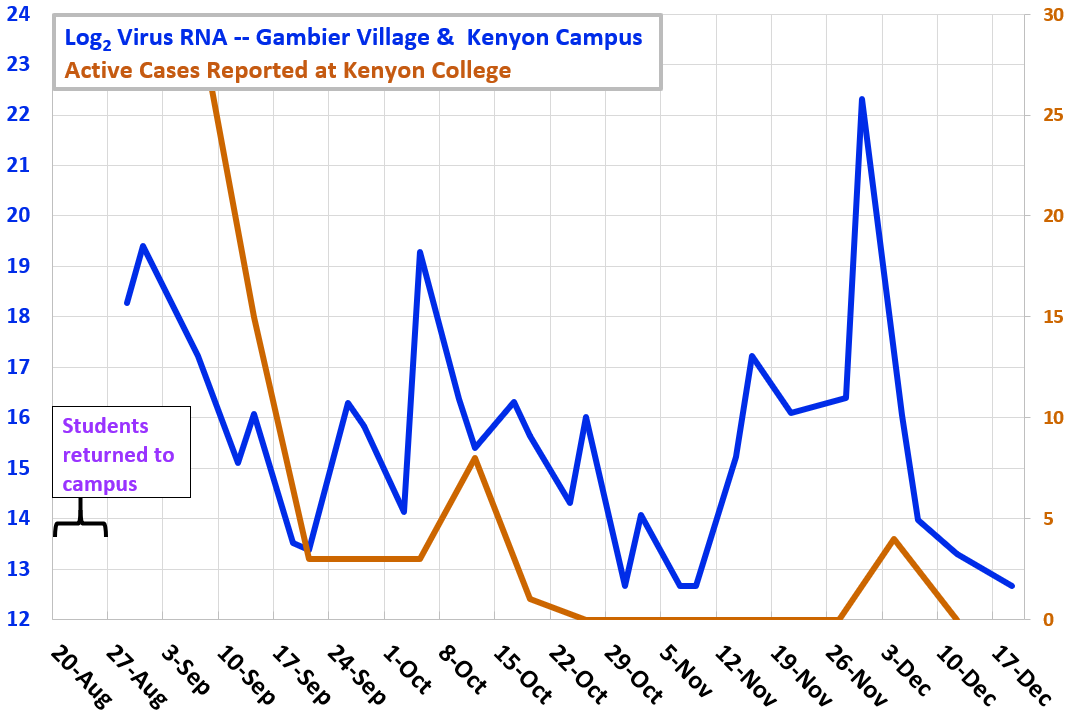
The Village of Gambier monitors wastewater for levels of RNA from dead coronavirus SARS-CoV-2, the cause of COVID disease. Samples are from the Village of Gambier Wastewater Treatment Plant. From August, 2022, viral RNA N2 has been measured and reported by the Ohio Department of Health. Kenyon active cases (students plus staff) were reported during the pandemic. For questions contact: slonczewski [at] kenyon.edu
Fall Term 2023
.png)
Spring Term 2023
Fall Term 2022
From August, 2021 through May 9, 2022, analysis was performed by students in the Department of Biology using the Berkeley 4S method and digital PCR. For questions contact: slonczewski [at] kenyon.edu
Spring
Term 2022

Fall
Term 2021

Winter and Spring 2021
From
June 8, 2020 through May 24 the Village of Gambier and Kenyon
College sampled wastewater for levels of RNA from dead coronavirus
SARS-CoV-2, the cause of COVID-19 disease.
On-campus wastewater testing was funded by the Ohio Water
Resources Center and Ohio Dept of Health.

●
Log2 concentration (doublings) of dead viral RNA per liter,
reported by Source Molecular (LuminUltra). RNA levels from
five Kenyon residential groups are scaled to population size.
⧫ COVID cases resident in
Village of Gambier (including Kenyon College) on dates that
tests were performed (Knox Public Health).
What is the UK variant?
- Our April 8 sample from the Village WWTP received an additional test for the B.1.1.7 variant, which originated in UK but is now found across the United States.
-
The B.1.1.7 test specifically detects a version of the
viral gene that encodes the spike protein, which enables
attachment to the human cell. The altered shape of the spike
protein enables the virus to infect human cells more
efficiently and produce a large number of virus particles.
- The greater virus shedding can increase subsequent transmission by 50%.

What do the virus levels mean?
-
Virus levels
above 500 RNA per
liter (29 = 512)
indicate active
infections in the Village.
-
The wastewater
signal often appears two weeks before individual clinical
tests are performed. This probably means that wastewater
reveals earlier cases missed by clinical qPCR (false
negative rate = 30%).
-
Wastewater can
detect infectious cases before the individual experiences
symptoms. Before symptoms, the infection may already have
spread to others. Cases can be asymptomatic.
-
Mask and
physical distancing can prevent their spread.

Does
a non-detect (failure to find virus) mean no virus is
present?
-
No, because
failure of virus detection in one sample means that
wastewater substances could have inhibited the lab
reaction. Single cases may avoid detection.
-
Two or more
non-detects suggest that virus levels are too low for
detection.
-
It takes just
one unlucky breath to start a new cluster.
Who is represented in
the sample?
-
The Village
sample (blue line) represents all individuals whose waste
enters the Gambier wastewater treatment plant. This
includes most village residents (approximately 700),
employees at local businesses and Kenyon College,
including all students on campus (approximately 1300).
-
The sample does
not include residences using septic fields, outside the
wastewater system.
-
During the first
semester 2020, the total village population in August was
estimated at 700 individuals, including 66 students. By
September, the total was approximately 1,600 including an
approximate number of 920 students on campus. Most
students departed over the period November 23-December 6,
leaving 66 students residing on campus. The village
population in December 2020 was then about 700.
-
During the
first semester, the NCAs sample (purple line) represented
only the 66 students on campus through January.
Will infected people get sick?
- Most people infected with SARS-CoV-2 experience no
symptoms, or mild symptoms. Their cases may or may not be
reported.
- However people without symptoms may spread virus to others
who get very sick.
- Wearing a mask protects others--and protects you from
getting large doses of virus that cause more severe
illness.
Where
do the data come from?
-
Composite
samples (over the most recent 24-hour period) are obtained
from the Gambier Wastewater Treatment Plant on Monday and
Thursday mornings.
- Samples are processed by Source
Molecular (LuminUltra) laboratory, where virus RNA is
amplified using CDC-approved primer sets N1 and N2.
- Results are obtained within 4-6 days of the sample.
-
The data are
interpreted by Kenyon faculty, in consultation with the
OSU Water Resources Center, Ohio Department of Health and
EPA collaboration for wastewater testing research.
Why do virus levels show high
variance?
-
Wastewater
composition varies with weather and inputs. The presence
of PCR inhibitors is variable.
-
Different
infected individuals shed different amounts of virus.
-
A single
individual may infect many people at once, leading to a
spike in signal that declines as cases resolve.
-
The rolling average
removes much of the variance.
Why
is there virus present when only occasional cases of
illness are reported?
-
Some infected
individuals show no symptoms yet they shed virus particles
and can transmit infection. The relationship between
reported and asymptomatic cases in a hypothetical
community is illustrated in this diagram (illustration
only, no data).


Is wastewater
SARS-CoV-2 virus a danger to the community?
- No, because the SARS-CoV-2 coronavirus in wastewater is
dead virus. Only RNA pieces of dead virus are detected.
- All wastewater is handled with PPE and shipped under
regulated conditions.
What
is happening to virus levels in the broader community?
-
Current virus
levels are high throughout Ohio, including the B.1.1.7
variant.
-
Mask wearing and
physical distancing are the best ways to keep virus
prevalence low.
-
Masks prevent
infecting others and decrease the amount of virus that
reaches the wearer.
